
صباح الخير
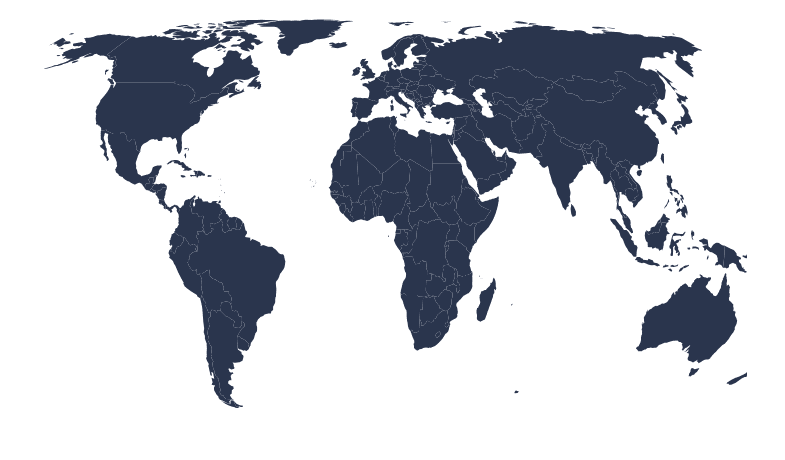
شباب ياريت لو حد يرشح مكتبة تعمل maps زي دي ولما اضغط علي اي قارة اعمل حاجة معينه
مثل اللي في الصورة 👇
صباح الخير
شباب ياريت لو حد يرشح مكتبة تعمل maps زي دي ولما اضغط علي اي قارة اعمل حاجة معينه
مثل اللي في الصورة 👇
اعتقد أنه يمكنك تنفيذ المطلوب من خلال استخدام مكتبة Leaflet. وهي مكتبة خرائط JavaScript مفتوحة المصدر تسمح لك بإنشاء خرائط تفاعلية . ثم، يمكنك استخدام حدث click لتشغيل وظيفة عند النقر على أي قارة. يمكن لهذه الوظيفة عرض معلومات حول القارة، أو الانتقال إلى خريطة أكثر تفصيلاً لهذه القارة، أو القيام بأي شيء آخر تريده.
فيما يلي مثال على كيفية إنشاء خريطة باستخدام Leaflet:
import L from "leaflet";

const map = L.map("map", {
  center: [0, 0],
  zoom: 1,
});

const continents = ["Africa", "Asia", "Europe", "North America", "South America", "Australia"];
for (const continent of continents) {
  const layer = L.layerGroup().addTo(map);
  L.geoJSON(continents[continent], {
    style: {
      fill: continents[continent],
      stroke: "white",
      weight: 1,
    },
  }).addTo(layer);
}

// Add an event listener to the map
map.on("click", function(event) {
  // Get the continent that was clicked
  const continent = continents[event.layer.id];

  // Do something with the continent
});
هناك الكثير من المكتبات لفعل ذلك مثل:
وأظن أن مكتبة DataMaps ستحقق لك ما تريد، وستجد شرح لاستخدامها هنا:
وإليك مثال:
<!DOCTYPE html>
<html>
<head>
  <meta charset="utf-8">
  <meta name="viewport" content="width=device-width">
  <title>Choropleth with auto-calculated color (Highmaps)</title>
  <style>
    #container1 { border:1px dotted blue; width: 700px; height: 475px; position: relative; }
  </style>
</head>
<body>
  <h1>datamaps.js example "Highmaps"</h1>
  <div id="container1"></div>


  <script src="//cdnjs.cloudflare.com/ajax/libs/d3/3.5.3/d3.min.js"></script>
  <script src="//cdnjs.cloudflare.com/ajax/libs/topojson/1.6.9/topojson.min.js"></script>
  <script src="//cdnjs.cloudflare.com/ajax/libs/datamaps/0.5.8/datamaps.all.js"></script>

<script>
    // example data from server
    var series = [
        ["BLR",75],["BLZ",43],["RUS",50],["RWA",88],["SRB",21],["TLS",43],
        ["REU",21],["TKM",19],["TJK",60],["ROU",4],["TKL",44],["GNB",38],
        ["GUM",67],["GTM",2],["SGS",95],["GRC",60],["GNQ",57],["GLP",53],
        ["JPN",59],["GUY",24],["GGY",4],["GUF",21],["GEO",42],["GRD",65],
        ["GBR",14],["GAB",47],["SLV",15],["GIN",19],["GMB",63],["GRL",56],
        ["ERI",57],["MNE",93],["MDA",39],["MDG",71],["MAF",16],["MAR",8],
        ["MCO",25],["UZB",81],["MMR",21],["MLI",95],["MAC",33],["MNG",93],
        ["MHL",15],["MKD",52],["MUS",19],["MLT",69],["MWI",37],["MDV",44],
        ["MTQ",13],["MNP",21],["MSR",89],["MRT",20],["IMN",72],["UGA",59],
        ["TZA",62],["MYS",75],["MEX",80],["ISR",77],["FRA",54],["IOT",56],
        ["SHN",91],["FIN",51],["FJI",22],["FLK",4],["FSM",69],["FRO",70],
        ["NIC",66],["NLD",53],["NOR",7],["NAM",63],["VUT",15],["NCL",66],
        ["NER",34],["NFK",33],["NGA",45],["NZL",96],["NPL",21],["NRU",13],
        ["NIU",6],["COK",19],["XKX",32],["CIV",27],["CHE",65],["COL",64],
        ["CHN",16],["CMR",70],["CHL",15],["CCK",85],["CAN",76],["COG",20],
        ["CAF",93],["COD",36],["CZE",77],["CYP",65],["CXR",14],["CRI",31],
        ["CUW",67],["CPV",63],["CUB",40],["SWZ",58],["SYR",96],["SXM",31]];


    // Datamaps expect data in format:
    // { "USA": { "fillColor": "#42a844", numberOfWhatever: 75},
    //   "FRA": { "fillColor": "#8dc386", numberOfWhatever: 43 } }
    var dataset = {};


    // We need to colorize every country based on "numberOfWhatever"
    // colors should be uniq for every value.
    // For this purpose we create palette(using min/max series-value)
    var onlyValues = series.map(function(obj){ return obj[1]; });
    var minValue = Math.min.apply(null, onlyValues),
            maxValue = Math.max.apply(null, onlyValues);


    // create color palette function
    // color can be whatever you wish
    var paletteScale = d3.scale.linear()
            .domain([minValue,maxValue])
            .range(["#EFEFFF","#02386F"]); // blue color


    // fill dataset in appropriate format
    series.forEach(function(item){ //
        // item example value ["USA", 70]
        var iso = item[0],
                value = item[1];
        dataset[iso] = { numberOfThings: value, fillColor: paletteScale(value) };
    });


    // render map
    new Datamap({
        element: document.getElementById('container1'),
        projection: 'mercator', // big world map
        // countries don't listed in dataset will be painted with this color
        fills: { defaultFill: '#F5F5F5' },
        data: dataset,
        geographyConfig: {
            borderColor: '#DEDEDE',
            highlightBorderWidth: 2,
            // don't change color on mouse hover
            highlightFillColor: function(geo) {
                return geo['fillColor'] || '#F5F5F5';
            },
            // only change border
            highlightBorderColor: '#B7B7B7',
            // show desired information in tooltip
            popupTemplate: function(geo, data) {
                // don't show tooltip if country don't present in dataset
                if (!data) { return ; }
                // tooltip content
                return ['<div class="hoverinfo">',
                    '<strong>', geo.properties.name, '</strong>',
                    '<br>Count: <strong>', data.numberOfThings, '</strong>',
                    '</div>'].join('');
            }
        }
    });
</script>

</body>
</html>
مثل التي في الصورة لم تمر علي لكن ما أعلمه هو أنه يمكنك استخدام مكتبة ReactJS مثل React-Leaflet أو React-Google-Maps لإنشاء خرائط في تطبيقك. تسمح هذه المكتبات بتكامل خرائط متقدمة مع تطبيقك الخاص بسهولة باستخدام ReactJS. مع التأكد من قراءة وثائق المكتبة التي تختارها للحصول على تفاصيل حول كيفية استخدامها وتنفيذ الوظائف المختلفة.